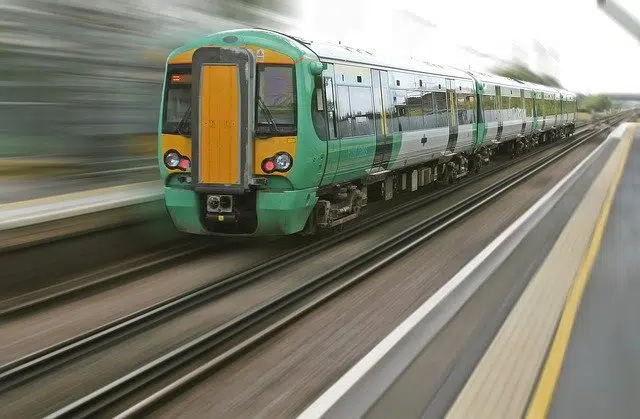
Speed is a rate of change.
The concept of rate of change refers to the extent to which one variable is modified in relation to another. This is the magnitude that compares two variables based on their units of change. If the variables are not related, they will have a rate of change equal to zero.
The most frequent rate of change is speed , which is calculated by dividing a distance traveled by a unit of time. This means that speed is understood from the link established between distance and time . According to how the distance traveled in time is modified by the movement of a body, we can know its speed.
Examples of rate of change
Suppose a car travels 100 kilometers in two hours. The rate of change between both variables is 50 kilometers per hour . That value represents your speed, since v = d/t (speed = distance/time).
Based on knowledge of a rate of change, it is possible to develop different calculations and forecasts. If we know the level of pollution that is reaching a stream from the dumping of chemical substances by an industry , it is possible to use the rate of change to indicate how quickly the level of pollution is increasing.
With a similar calculation, the speed of spread of an epidemic in a certain city can be calculated, taking as data the number of people who contracted the virus in x days.

The rate of change links two variables: for example, distance and time.
Classification according to type
It is possible to distinguish between two types of rate of change: the average and the instantaneous , which are explained below. It is important to highlight that by making use of these concepts, the doors are opened to the solution of certain problems for which algebraic methods are not effective.
Average change ratio
Our daily life confronts us with various reasons for changes in social, economic and natural situations, among others, in which we want to know what is the largest or smallest value (the maximum and the minimum, respectively), its growth or its decrease in a given period of time . These are problems in which we study phenomena related to the variation of a magnitude that depends on another, which is why a description and quantification of said changes is necessary through graphs, tables and mathematical models.
Just as in the example of the car that travels 100 kilometers in two hours, the problems that lead us to calculate the average rate of change yield results in which a variation is determined that does not necessarily exist in reality at all times; In other words, we do not know if the car has maintained this speed throughout the two hours, but rather we estimate the average number of distance units at which it had to travel to complete said journey.
Instantaneous rate of change
The instantaneous rate of change is also called the second derivative and refers to the speed with which the slope of a curve changes at a given moment. Let us not forget that the rate of change shows the proportion in which one variable changes with respect to another or, from a graphical point of view, the slope of a curve.
If we return to the car example, the instantaneous rate of change could be useful to know the distance traveled at a specific point in the two hours, which is the total time period analyzed in the problem . Unlike the average ratio, the snapshot has a very specific vision, since it seeks to know or correct values before the end of the period.
