The random evolution of processes over time is known as a stochastic process.
The etymology of stochastic takes us to the Greek word stochastikós , which can be translated as “conjectural.” The term is used to refer to that linked to chance : that is, to chance.
Random evolution
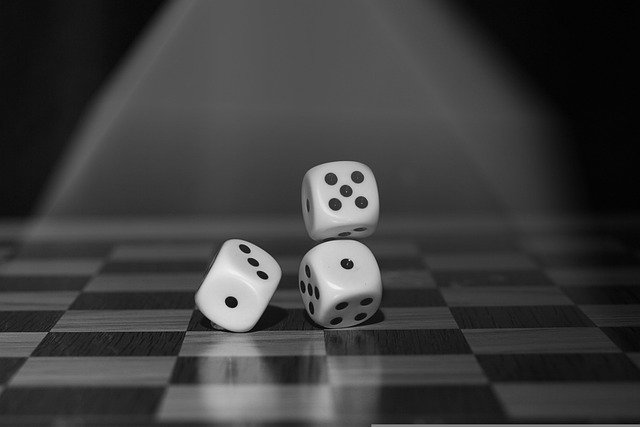
In the field of mathematics, the theory focused on processes that evolve randomly over time is known as stochastics. A common example of a stochastic process is a series of rolls of a die.
While a stochastic system has intrinsic behavior, the opposite is a deterministic system , in which chance does not affect how future states develop. In other words, in the stochastic system there are random issues involved in the states that occur.
In stochastics, therefore, there is a sequence of events that changes over time . This future includes the intervention of chance, which involves the interference of randomness . In computing this can be emulated to offer us seemingly random values, something very useful in different areas to make digital creations more natural.
Returning to the theory of probability that appears in the field of mathematics , a stochastic process contemplates the use of random magnitudes for the characterization of a series of variables whose evolution depends on another variable, which is usually time. These random variables, which are sometimes correlated with each other, have their own probability distribution function.
Stochastic oscillator
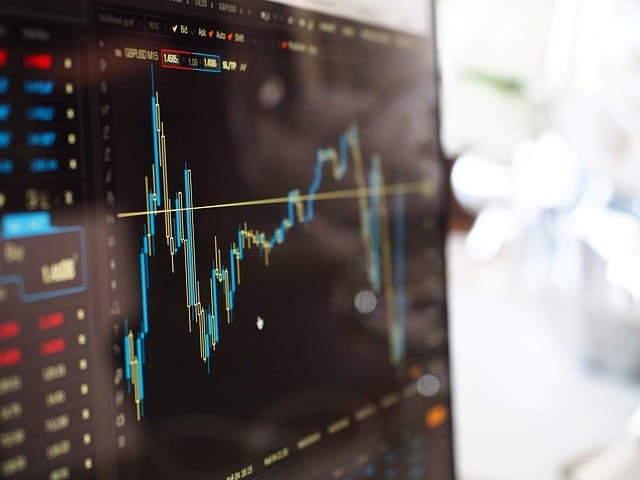
In the stock market context, finally, we speak of a stochastic oscillator to name a variable that is established according to the position of the price of a share or another security with respect to its minimum and maximum in a certain period.
This concept is also important for the analyst with respect to the decision to buy or sell the stocks he studies: when his line crosses his moving average there comes the moment in which he can perceive the relevant signals more clearly. Here we have more than one possibility:
* ascending cut : when the line exhibits this behavior, the analyst knows that he should buy;
* descending cut : opposite to the previous case, this is the sell signal.
It is important to note that in both the rise and fall, if after the cut the line remains in the zone, the analyst interprets that the signal remains the same. There are also overbought and oversold zones, which have great relevance. Its detection arises from cutting the graph in half, where the so-called "neutral zone" is located. Then, two more lines are drawn, delimiting 20 and 80 percent. The overbought zone is the one we observe between 80 and 100 percent, while the other is between 20 and 0 percent.

In the stock market field, the stochastic oscillator is a fundamental tool for analysts.
Safe practices
The stochastic oscillator is a very useful tool, which has been tested over a long time by stock market specialists around the world. However, it is not something that is infallible or that alone can lead us to success in the stock market. Analysts use it in combination with their knowledge and various tactics to make their decisions while reducing risks to a minimum.
For example, before buying or selling, they usually wait for at least two signals in a row with the same trend ; If there are three, even better. Another aspect that they take into account to reinforce their decisions is that the curve cutting takes place in the aforementioned areas close to the extremes, the overbought and oversold areas. Finally, the breaking of a significant support or resistance can also be used to decide if it occurs after the signal.
