
A map, through the graphic scale, can be easily interpreted and analyzed with respect to real distances between two or more points.
A graphic scale is a visual representation that is made from a straight line that is segmented into identical parts and is characterized by being graduated. It serves to guide the observer of a map in terms of a perspective of the distances that, in reality, exist between points that are being analyzed and, at the same time, to capture ideas in a construction project, to point out one case.
This is a resource that began to be used many years ago in order to offer proportions that can be understood from the sense of sight. According to historical records, the first application dates back to the 13th century in Italian territory, specifically on the map known as Carta Pisana . At that time the design was circular. Over the years, a format was adopted that continues to this day and consists of a straight line that is located, in horizontal or vertical orientation, at the edges of the maps .
Graphic scale classes
It is possible to distinguish, in practice, multiple kinds of graphic scale . It is important to know the characteristics of each one in order to know how they are similar and how they differ. In this way it will be possible to take advantage of the most convenient option for each case.
The numerical scale , to indicate a specific alternative, uses a fraction or a number to express the relationship that exists between a drawn image and its real dimensions. Thus, therefore, this data refers to how many times the drawing must be enlarged for it to reach its true size. It is usually taken into account when carrying out an architectural projection , a technical drawing work or a map .
If we focus our attention on the proportion scale , however, we will arrive at a quantitative tool. It is a variety of measurement scale that makes it possible to compare intervals or simply invites us to notice differentiations between variables .
Independently of them, there are the cartographic scale (which deals with the link that exists between a distance that has been measured on a map and its similar dimension projected on a surface), the ratio scale (also called the quotient scale) and the interval scale (it is a measurement scale that has a quantitative profile and leads to determining differences between a pair of variables).
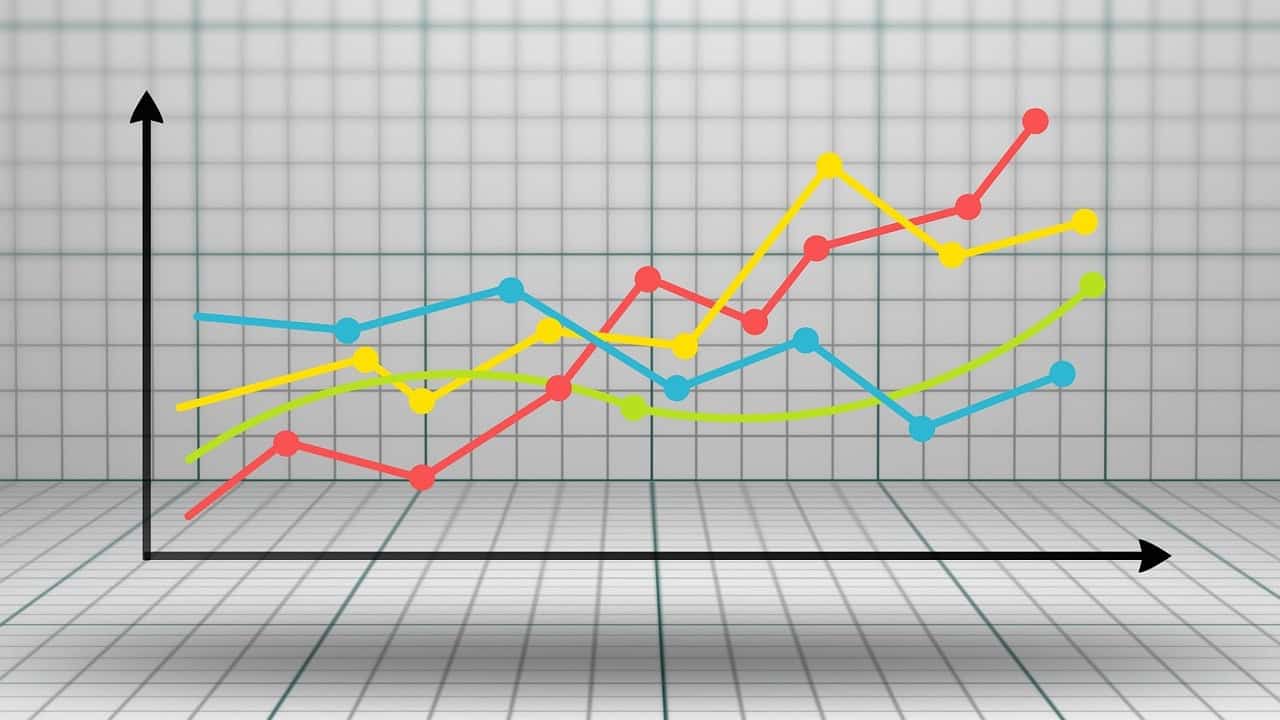
More than one infographic and data analysis is carried out using a graphic scale.
Designs, aesthetics and distinctive elements
There are designs , an aesthetic , and distinctive elements inherent to a graphic scale .
In this context it is necessary to refer to the coordinate axis , which can be a horizontal axis (represented by the letter X and without numerical intervals) or a vertical axis (symbolized with the Y).
This information leads to another concept with multiple ramifications: that of the coordinate system (which, in turn, is subdivided into the polar coordinate system , the Cartesian coordinate system , etc.). Geometry , astronomy , geography , etc. use it.
The axes can also be accompanied by a graduation mark at the interval, the upper limit and the lower edge. Nor can it be overlooked that when viewing a map it is common, on the other hand, to discover a legend whose purpose is explanatory and descriptive: it tells what each symbology , drawing or color means. In this way, the process of detecting in the representation in question everything from a stream or provincial route to a hotel, a hospital or a church is facilitated.
In the design of a graphic scale , by emphasizing the creation stage, factors of the visual style come into play, the level of contrast and color , the choice of a typographic font that is appropriate in shape and size, the alignment and the visual balance between each of the components. It is worth becoming technologically literate if you are looking for some modern software or computer tools to develop graphic scales with graphic design programs . For maximum use of a graphic scale, it is suggested to apply the most appropriate type of scale, maintain a coherent representation style, provide facilities for interpreting data and guarantee visual accessibility .
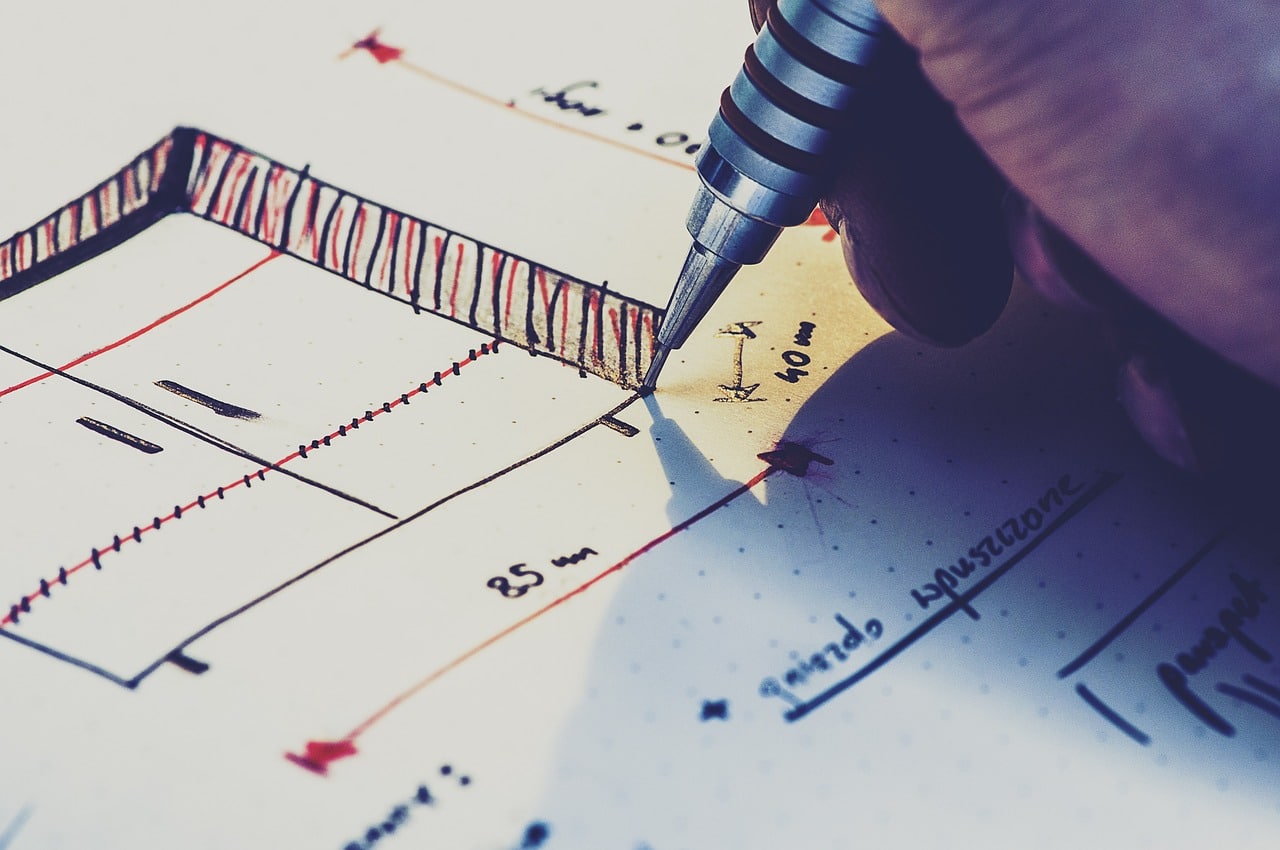
When making a technical drawing you can choose, for example, between enlargement scales, natural scales and reduction scales.
Applications of a graphic scale
The applications of a graphic scale are very diverse and useful, especially in activities related to architecture , engineering and cartography . They facilitate, among other issues, the visualization of data because they represent or reflect information in a precise and clear way, contributing to the understanding and comparisons of variables without the need to carry out complex mathematical calculations.
Graphic scales are also great allies for those who are dedicated to computer-aided design (CAD) , technical drawing or map design . Whoever learns to interpret a graphic scale is qualified to calculate real distances, as the conclusion is reached by evaluating and applying theoretical knowledge in practice.