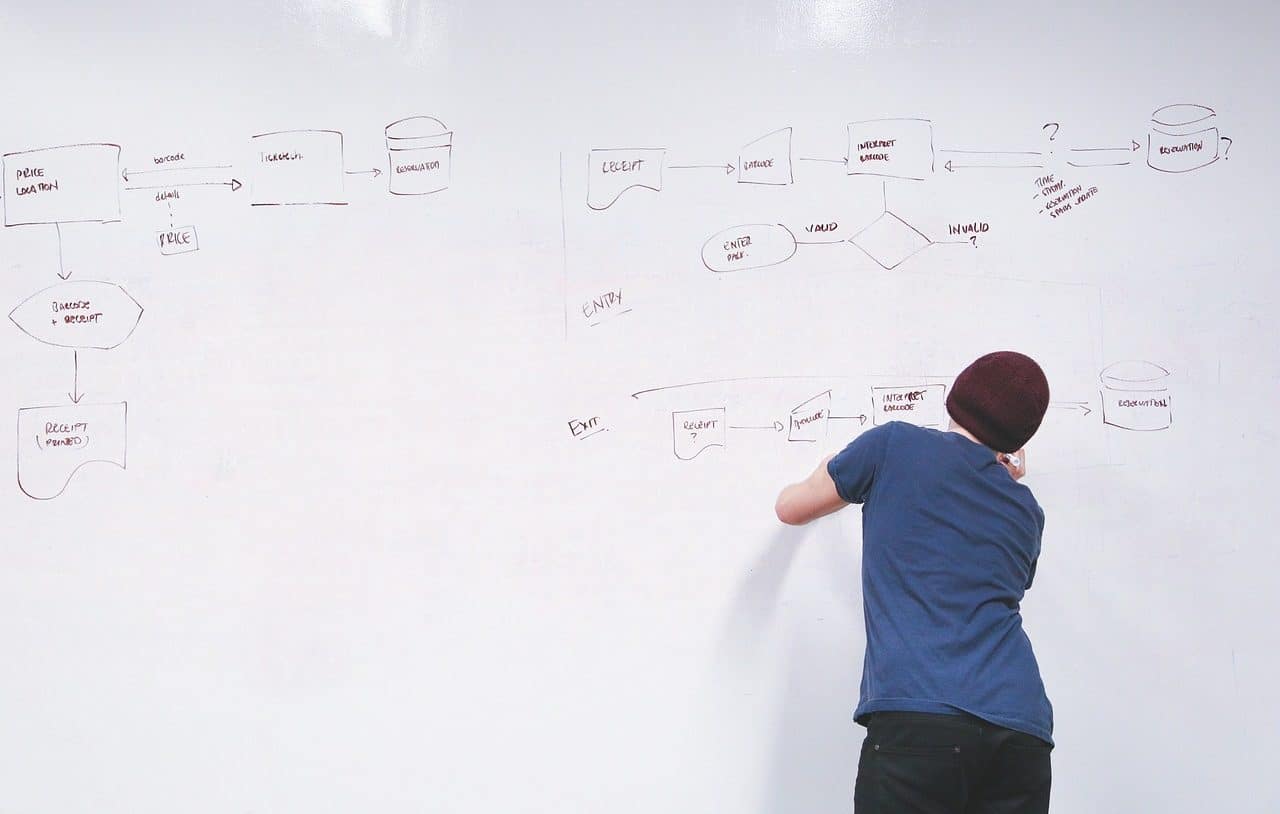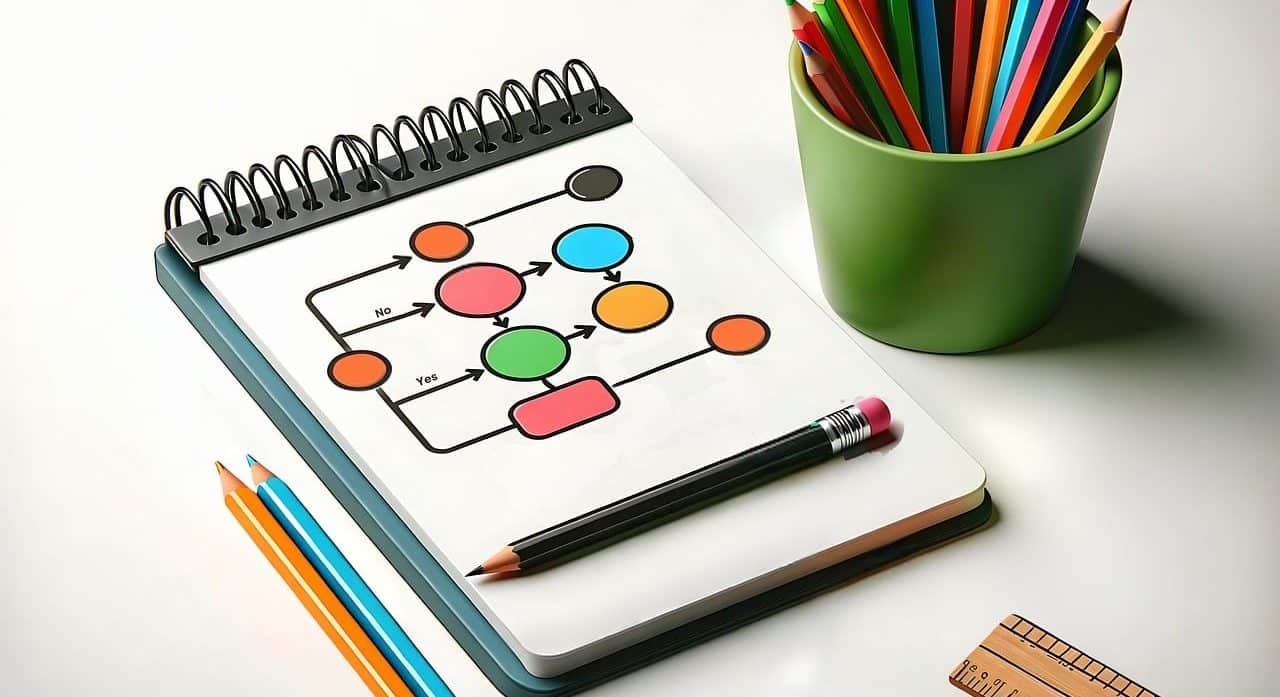
A flow chart can contribute to process optimization.
A flowchart is a drawing that represents the different steps of a procedure or the successive events that are part of something. These diagrams are used to see the stages or moments of what it is intended to represent.
A graph that shows the links between the various elements that make up a system or a set is called a diagram . The idea of flow , for its part, can refer to different issues: in this case we are interested in its meaning as the process and consequence of flowing (moving forward, sprouting).
Flowchart Examples
Flowcharts are usually present in instruction manuals or user manuals .
Take the case of a television. On one of the pages of its manual , a flow chart is shown that begins with the question "Is your TV not showing a picture?" . From that block comes a downward arrow that leads to another question "Is the TV on?" . In this instance, a right arrow points to the “No” option and is linked to the “Turn on the TV” prompt. Another arrow, however, continues down for the “Yes” option and gives way to another question: “Are you connected correctly to the cable or television signal?” . In this way, through different arrows and blocks with questions and possible answers, the flow diagram is put together.
You can also generate a flowchart to organize website content. Let's think about a bar and restaurant: starting from the "Cover" , "Main Page" or "Home Page" , three downward arrows appear: "We" , "Breakfast / Snack" and "Lunch / Dinner" . From “We” can come other arrows that give rise to more web pages, such as “About us” , “Address” and “Contact” . The flowchart can continue with arrows originating from “Breakfast/Snack” and “Lunch/Dinner” to present the specific menu of each proposal.
In short, project management , process auditing , business analysis, problem solving and decision making, for example, can be facilitated through flowcharts.

Strategic planning benefits from the use of flowcharts.
Its characteristics
Typically, a flowchart has a single starting point and a single closing point . However, it is possible to add more if the structure responds to the logic of this way of organizing information. To find a well-constructed flowchart, it is necessary to follow a series of well-defined steps and take into account certain issues regarding the nature of the graph, its application and its effectiveness.
First, we need to identify the most important ideas we want to include in the flowchart. This requires the participation of both the author of the process and any person who has been involved in some way throughout it, or whose work will be relevant in future phases. Because the data in a flowchart must be concise and substantiated, only someone with the relevant technical knowledge can choose it and assign it an appropriate location.
Once we have identified the topics to be discussed, it is time to define the objectives that we intend to achieve by creating the flow chart. This usually remains in the background, despite being a fundamental aspect of any process: how can we evaluate the effectiveness of a system if we have not developed it with a series of clear goals from the beginning?
Similar to the previous point, before starting to create the flowchart we need to know who it is aimed at , what their needs are and how they will use it. If we think about a history lesson, for example, the language and challenges will not be the same for a university student as for a young child, even if the topic being discussed is the same.
This is also linked to the degree of detail of the information, something that we must define with complete clarity from the beginning, to avoid consistency errors that affect the clarity of the material.
It should be noted that for the data flow and process map to be clear, the diagram must include connectors, a start/end symbol, an input/output symbol, a decision symbol, a process symbol, etc. They must be easily recognizable visual resources to interpret the information. The task is simplified when you turn to flowchart software tools that automate actions and make steps easier.

A risk analysis can be developed using a flow chart.
Flowchart Types
According to their characteristics, we can identify several types of flowcharts.
Panoramic format flowcharts are those that are developed vertically and horizontally, with simultaneous actions . Horizontal format flowcharts, on the other hand, present a sequence developed only from left to right, while vertical format flowcharts go from top to bottom, like an ordered list of activities or steps.
