In order to know the meaning of the term indifference curve, it is necessary, first of all, to discover the etymological origin of the two main words that give it shape:
-Curve, first of all, comes from Latin. Specifically, it derives from “curvus”, which can be translated as “curved”.
-Indifference, secondly, also emanates from Latin. In its case, it derives from “indifferentia”, which is synonymous with “quality of not distinguishing” and which is the result of the sum of four delimited components: the prefix “in-”, which means “not”; the element “dis-”, which is synonymous with “separation”; the verb “ferre”, which can be translated as “carry”; and the suffix “-ia”, which is used to indicate “quality”.
In the field of economics, it is common to appeal to the notion of a curve with reference to the graphic representation of the magnitude of a phenomenon: demand curve , supply curve , etc.
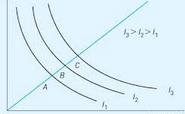
 On this occasion we are going to focus on the concept of indifference curve , which allows us to know the different combinations of products that provide the buyer with the same degree of satisfaction. This makes it possible to analyze consumer behavior.
To obtain the indifference curve, the individual must be asked which combination of two products they prefer, varying the quantities of each one. The greater the amount of a product R , the greater the amount of a product S and vice versa. When arriving at two options that are indifferent to the person, both points are on the same indifference curve. On this curve, all points provide the same level of satisfaction .
What the indifference curve does is reveal predilections between pairs of products , without taking into account the price of the good or the consumer's income. On the indifference curve, in fact, the different points have different monetary values, although the satisfaction they provide to the consumer is the same.
An indifference curve can be drawn combining pizzas and empanadas , for example. The consumer can choose different combinations: 4 pizzas and 24 empanadas, 6 pizzas and 18 empanadas, 8 pizzas and 12 empanadas, etc. The curve reveals how many pizzas you are willing to give up to buy more empanadas, and the same thing but in reverse (how many empanadas you would give up to buy more pizzas).
In addition to everything indicated, we cannot overlook an important series of data or characteristics of the so-called regular indifference curves, such as these:
-They do not cut each other.
-They have a negative slope.
-They are convex to the origin.
-The further they are from the origin, the higher the level of utility they have.
-The slope of an indifference curve is called the marginal rate of substitution.
Likewise, you must know that there are several types of indifference curves. Specifically, among the most frequent ones we can speak, for example, of both the indifference curves of goods that are perfect complements, as well as the so-called indifference curves of goods that are perfect substitutes.
